
The Citron Scorecard: How Andrew Left’s Targets Actually Traded
A great deal has been written about the man. Far less has been written about the numbers. We pulled every Citron Research call in our database and measured what happened to the stocks.
Activ8 Newsroom • June 23, 2026
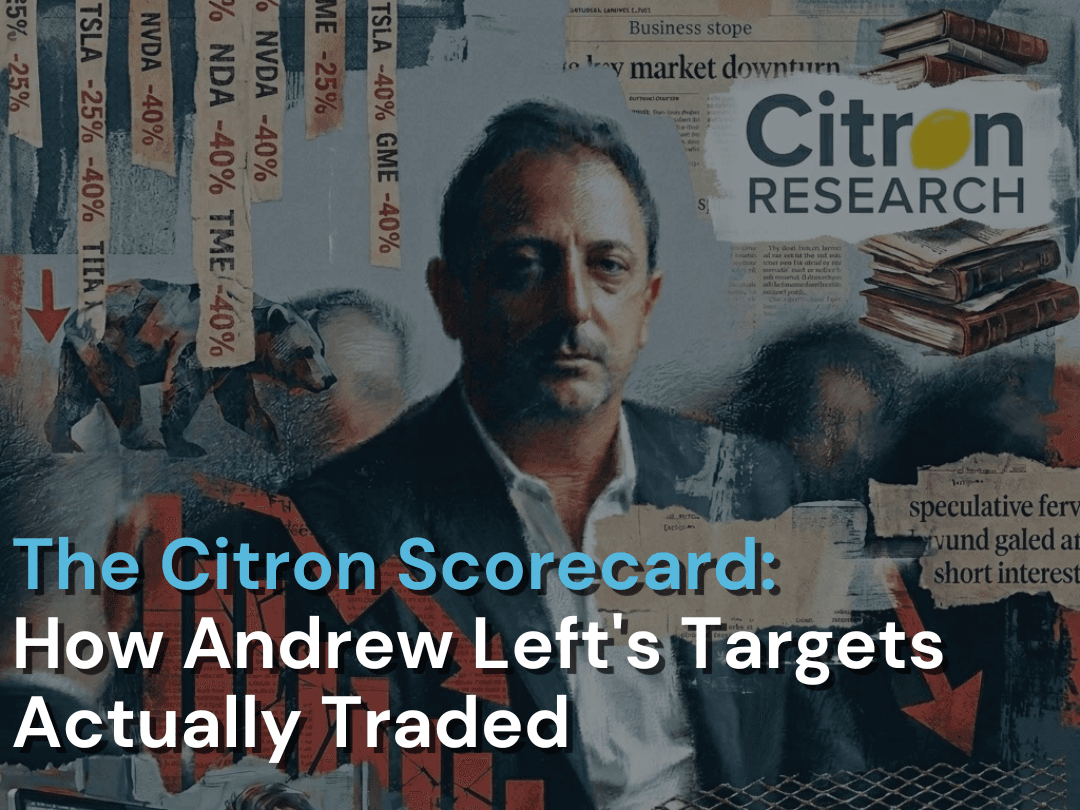
- The calls landed in the short window: Across all 50 campaigns, the average target fell 9.8% within five trading days, and 76% closed lower than the report-date price.
- The first day did most of the work: The average one-day reaction was a 5.9% decline, with more than three-quarters of targets closing red on day one.
- The long run is a barbell, not an average: The mean return since publication is a positive 252.2%; the median is negative 72.4%. A dozen targets that later became giants pull the average beyond recognition.
- Most targets broke: 16 of the named companies were eventually delisted, and roughly two-thirds traded below their report-date price when last measured.
- The misses were timing, not thesis: Several names that shrugged off the report in week one were lower a year later. A short report is a trade with a horizon, and judged on that horizon Citron hit far more than it missed.
Andrew Left has been profiled, sued, indicted and, as of June 2026, convicted. What he has rarely been is measured. Strip away the personality and the courtroom and a simpler question remains, the one a trader actually asks: when Citron Research published, what did the stock do? The answer sits in the price data, and it is sharper than the caricature drawn by either his admirers or his critics.

Analyzed
Win Rate
Reaction
Delisted
Based on 50 documented Citron campaigns, 2008 to 2026. Green reflects a short-seller's perspective, where a falling stock is a positive outcome.
The Short-Term Verdict

A short report is a catalyst. It is built to move a stock in days, not decades, and the short window is where Citron looks strongest. Its targets fell an average of 5.9% on the first trading day and 9.8% by the end of the first week. The median was nearly identical, a 10.0% decline, which matters more than it sounds: when the average and the median sit on top of each other, the result is not one spectacular blowup dragging a crowd of duds behind it. The typical call worked.
The hit rate tells the same story. More than three-quarters of targets traded lower the day after publication, and again five days out. Two-thirds were still underwater a month later, and exactly half had dropped at least 10% inside a week.
The Horizon Problem
This is where a naive reading of any short seller falls apart. Average the return of every Citron target from its report date to today and the figure comes to a positive 252.2%, a number that makes his targets look like stocks worth owning. The median says the opposite: negative 72.4%. When the mean and the median disagree this violently, trust the median. Something is moving the average.
That something is a short list of extraordinary winners. Citron published cautionary work on NVIDIA, Tesla, Shopify and Ubiquiti, four names that went on to rank among the best-performing stocks of the era. Measured to today, NVIDIA is up more than 7,000% from the report date and Tesla more than 3,700%. Two reports out of 50 pull the average of the entire group up by thousands of basis points.
Set those outliers aside and the long-run record is a barbell. Roughly two-thirds of targets ended below their report-date price, 21 of them fell 90% or more, and 16 were delisted outright. At the other extreme sit a dozen names that doubled or better. The middle is nearly empty. The chart below plots every target's return since its report date, sorted worst to best.

If one name anchors the left side of that barbell, it is Valeant. On October 21, 2015, Citron published its report on the drugmaker, questioning its relationship with the specialty pharmacy Philidor and likening the arrangement to Enron. The stock did not need years to break. It broke in days, and then it kept breaking.
A 20.3% drop on day one and 24.8% inside a week put Valeant among Citron's hardest immediate reactions. Unlike the targets that bounced and faded, this one compounded: down 84.9% a year later and roughly 96.6% from the report price by our last measurement. The company never recovered the name. In 2018 it abandoned Valeant entirely and relisted as Bausch Health, which is why the ticker VRX in our archive now trades as BHC. It is the rare campaign that worked on every horizon at once, and the cleanest illustration of what the since-report math looks like when a thesis is right and the market never forgives the name.
Early, Not Wrong
The barbell invites a fair question: what about the targets that did not break? Some never did. But a good share of the apparent misses were a matter of timing, not a flawed read. Eight names that actually rose in the first five days after a Citron report were trading lower a year later. The report was early. The market caught up.
| Ticker | Company | 5-Day | 1-Year |
|---|---|---|---|
| AXDX | Accelerate Diagnostics | +15.6% | -25.9% |
| PLUG | Plug Power | +11.9% | -52.2% |
| GOTU | Gaotu Techedu | +9.9% | -22.8% |
| ACB | Aurora Cannabis | +7.2% | -50.2% |
| HLG | Hailiang Education | +6.6% | -43.4% |
| NFLX | Netflix | +5.4% | -11.6% |
| INGN | Inogen | +2.7% | -61.6% |
| MNST | Monster Beverage | +1.1% | -16.6% |
This is why Activ8 treats theses that do not play out immediately as early rather than wrong. A stock that climbs the week a report lands and then sinks over the next year did not refute the research. It only punished anyone short the name on a one-week leash.
Citron is one name in a database of more than 1,000 campaigns. The dashboard ranks every investigator by win rate and average impact, so you can see exactly where Andrew Left sits against Muddy Waters, Hindenburg, Kerrisdale, and the rest, before you act on anyone's next report.

Where Citron Hunted
The target list has a clear shape. Healthcare was the most common sector at 17 reports, with technology next at 12, the two together making up well over half of every call. By size the book skewed small: 19 of the 50 targets were micro-caps under $300 million, the corner of the market where the most fragile stories live and where short reports tend to bite hardest.
The reactions did not scale neatly with size, though, and not in the direction intuition suggests. The sharpest five-day declines landed in the middle of the market-cap range. Mid-cap targets fell 16.0% on average over five days and small-caps 13.8%, while the megacaps, the NVIDIAs and Teslas, barely flinched on the report itself and saved their drama for the years that followed.
The book was overwhelmingly domestic, with 39 of 50 targets listed in the United States and the rest scattered across Canada, China, Israel, Japan, Germany and Ireland. Two-thirds traded on the Nasdaq, the natural home of the growth and story stocks that activist research tends to circle.
What the Scorecard Says
Set the personality and the courtroom aside, which is what we set out to do, and the data describes a research operation doing exactly what activist short research is supposed to do. The reports moved stocks, fast and in the intended direction, far more often than not. Three-quarters of targets were lower within a week. The average call shed nearly 10% in five days. Sixteen of the named companies no longer trade at all.
The long-run average flatters the targets for one reason only: a few of them, NVIDIA and Tesla above all, became among the most valuable companies on earth. That is a story about the limits of a hold-forever yardstick applied to a days-to-weeks instrument, not a story about weak research. On the horizon a short report is built for, the Citron record reads as one of the more consistent in the field.
The noise around Andrew Left is one story. The numbers are another, and they hold up without it.
We pulled this scorecard from the same database that powers the Activ8 dashboard: more than 1,000 campaigns, with researcher track records, deep-dive report pages, and instant alerts when one of your holdings gets targeted. The intelligence layer built for every retail trader.

Sources & Notes
- [1]Activ8 Insights proprietary report database. 50 documented Citron Research campaigns with complete price history, August 12, 2008 to April 10, 2026. Returns computed from split and dividend adjusted closing prices measured from each report's publication date.
- [2]Valeant Pharmaceuticals (VRX, October 21, 2015), now Bausch Health (BHC), is included in all return figures; its market cap was unavailable in the export, so it is excluded from the market-cap size tiers only.
- [3]Win rate defined as the share of targets trading lower over the measured window. Delisting count and outlier returns drawn directly from the database as of last measurement.
More in News

Consolidation Comes to Activist Short Selling
A landmark acquisition, back-to-back collaborative reports, and interviews with investigators point to a shift in how activist short selling gets done.
Activ8 Newsroom • July 7, 2026
Activist Short Selling After the Andrew Left Decision: Pt 1
Andrew Left was convicted for trading against his own calls, not for his research, and what the verdict really changes for activist short selling will not be settled until the appeal.
Activ8 Newsroom • June 4, 2026
Andrew Left on Trial: The Case That Could Redefine Activist Short Selling
On May 11, 2026, the federal criminal trial of Andrew Left, founder of Citron Research, opened in Los Angeles, with prosecutors alleging he generated $16 million by trading against the very recommendations he published. It is the first criminal prosecution of an Activist short seller, and its outcome could reshape what every Investigator is permitted to say while holding a position.
Activ8 Newsroom • May 11, 2026